“Numbers have an important story to tell. They rely on you to give them a clear and convincing voice.” Stephen Few
Aggregated raw data is the data without direction. It needs a mindful insight and the right questions to make logic out of it. Many insights fail to analyse data completely and become difficult for the stakeholders’ comprehension,therefore, it becomes necessary for a data analyst to define and understand data with the right set of initial questions and a standardized workflow for the different types of analysis he needs to perform.
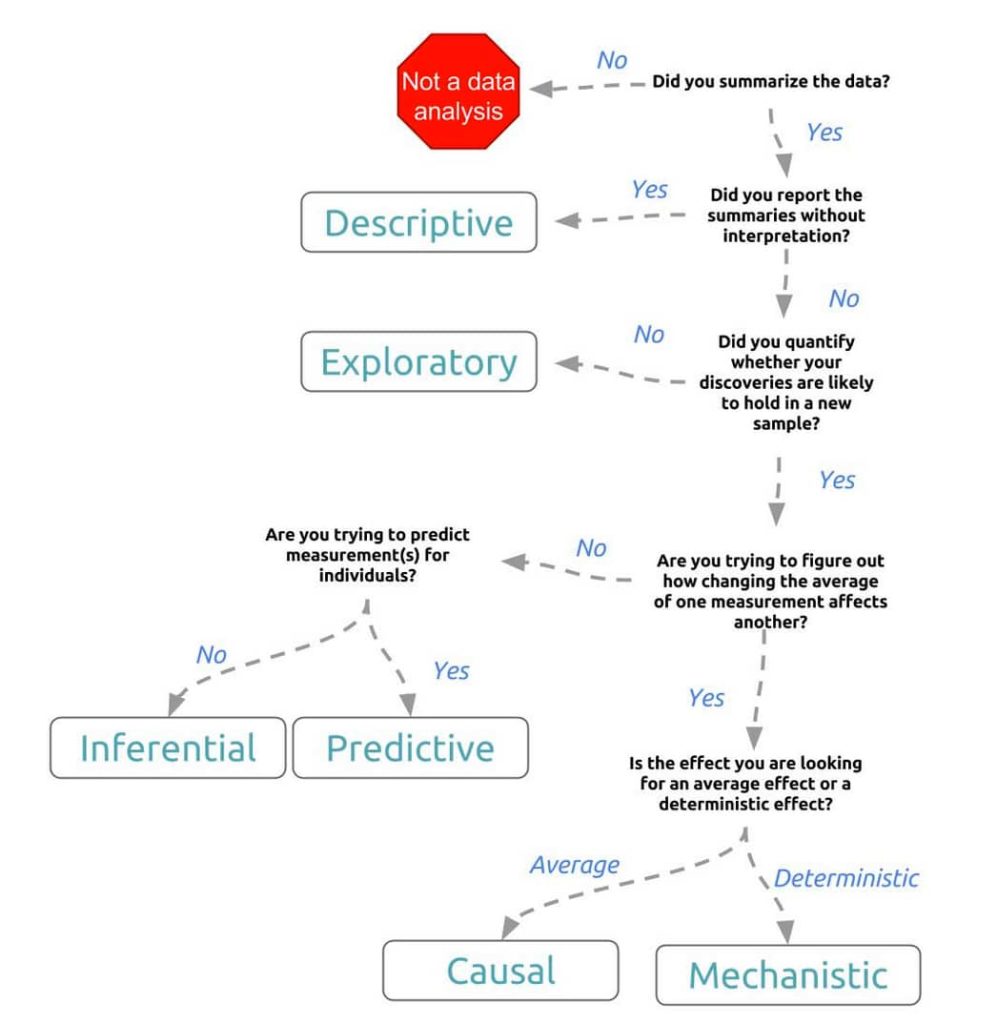
The following chart from Jeff Leek’s interesting book on “The Elements of Data Analytic Style” broadly categorizes the various stages of analysis with respect to the question type, and the resulting goal expected for the specific business requirement.

Descriptive Data Analysis
As the name suggests, this type of analysis provides simple “descriptions” or summaries about the accumulated raw data set and about the observations that have been made on top of the same.
Such summaries can be quantitative and visual in nature, with data represented using statistics and various simple graphs. This initial summary is void of any further investigation and is used as summarized to interpret information.
Example: Data of segregation of students enrolling for a particular course in college:
The data may be divided into different categories like number, gender, residence, age, race, etc. This information summarizes/ groups data into a fixed data set which describes total number of students with their detail information. It does not suggest anything and simply informs us the details, therefore, it is an example of descriptive analytics.
Exploratory Data Analysis
Analysis on top of descriptive data output, which is further investigated for discoveries, trends, correlations or inter-relations between different fields of the data, in order to generate an interpretation, idea or hypotheses; forms the basis of Exploratory Data Analysis (EDA).
In short, it is going beyond the descriptive data set and attempting to create a knowledgeable gist of the same. As Dianne Cook and Deborah F. Swayne rightly quote in their book, “(EDA is) a ‘play-in-the-sand’ to allow us to find the unexpected, and come to some understanding of our data.”
The focus here is not always the outcome of the problem statement, but to explore broadly the different aspects of the data in hand, to get to know it better.
Example: An EDA application analyzes the behaviour of traffic in different cities in the world. While the information gathered can be varied in nature, different unexpected discoveries can be made, such as the rate at which accidents occur at traffic signals, the pollution generated on a daily basis due to exhaust generated by vehicles and even the traffic congestion rates, per week. While the outcome of the actual problem is not always yielded by the above observations, still the collected information with other data can be useful in order to confirm the outcome.
Inferential/Quantified Data Analysis
The difference between inferential and exploratory analysis can be determined by understanding, whether the analysis provides consistent insights across different samples beyond the one in hand.
Example: Calculating mean of the marks scored by students in an exam against difficulty index of the exam for 100 students could provide valuable information about the group of 100 students.
This information can also help in determining the strength of the relationship between these two dimensions in understanding the performance of students across examinations. Though it is not always possible to determine the why these relationships exist, it is possible to identify the strength of a particular relationship in determining inferential outcomes.
Predictive Data Analysis
Predictive analysis aims at predicting possible outcomes from a subset of values from the original population set. This attempt to predict new insights is mainly on the basis of measurable metrics in the existing data set.
Predictive analysis cannot always quantify the relationships between two dimensions like inferential statistics, but it rather relies on probabilities between them to identify future outcomes.
Example: Analyzing the popularity and influence of nominees standing for an election in order to predict the outcome of the same.
Here we can infer the possibility of the candidate’s success from data on topics he addresses, his liberal and conservative views, data on state-wise popularity of the candidate, etc. While we can project potential outcome with this data, we cannot conclude the outcome with accuracy.
Causal Data Analysis
Applying changes to one dimension/ measurement to get a concluded form of another dimension, forms the basis of causal analysis. It aims at finding both, the magnitude and direction of the measurements unlike the above two, that is predictive and inferential analysis.
Example: Randomized clinical trial to identify whether fecal transplants reduces infections due to Clostridium di-ficile.
In this study, patients were randomized to receive a fecal transplant plus standard care or simply standard care. In the resulting data, the researchers identified a definite relationship between transplants and infection outcomes. Thus, the causal analysis of patients led to a definite average outcome using raw data.
Mechanistic Data Analysis
While causal data gives a definite average outcome, the goal is not only to understand that there is an effect from the inferences from data, but how that effect operates on the outcome.
Example: Mechanistic analysis that analyzes how wing design changes air flow over a wing, leading to decreased drag. Outside of engineering, mechanistic data analysis is extremely challenging and rarely undertaken.
Conclusion
As you can see, harnessing big data analytics can deliver big value to business, adding context to data that tells a more complete story. By reducing complex data sets to actionable intelligence stakeholders can make more accurate business decisions. If you understand how to demystify big data for your customers, then your value has just gone up tenfold.
